THIS SURVEY EXPLORES CANADIANS’ AND AMERICANS’ PERSPECTIVES ON MUNICIPAL POLITICS AND CANADIANS’ FEDERAL VOTING INTENTIONS
Many municipal elections have recently taken place (or will take place soon) across Canada and the United States. We surveyed Canadians and Americans to explore their perspectives on municipal politics, including how well their mayor and council are performing and whether they would like to see a new mayor and council next election.
We also asked Canadians about their federal voting intentions, given the recent election of Pierre Poilievre to leader of the Conservative Party of Canada.
Download the report for the full results.
This survey is conducted in collaboration with the Association for Canadian Studies (ACS) and published in the Canadian Press. This series of surveys is available on Leger’s website.
Would you like to be the first to receive these results? Subscribe to our newsletter now.
MUNICIPAL POLITICS
- Canadians (51%) are more likely than Americans (45%) to approve of the job their current mayor and council are doing. Approximately one-third (32% of Canadians and 34% of Americans) disapprove.
- 53% of Canadians and 55% of Americans say things are about the same in their municipality based on the job the mayor and council have done since elected, rather than better or worse.
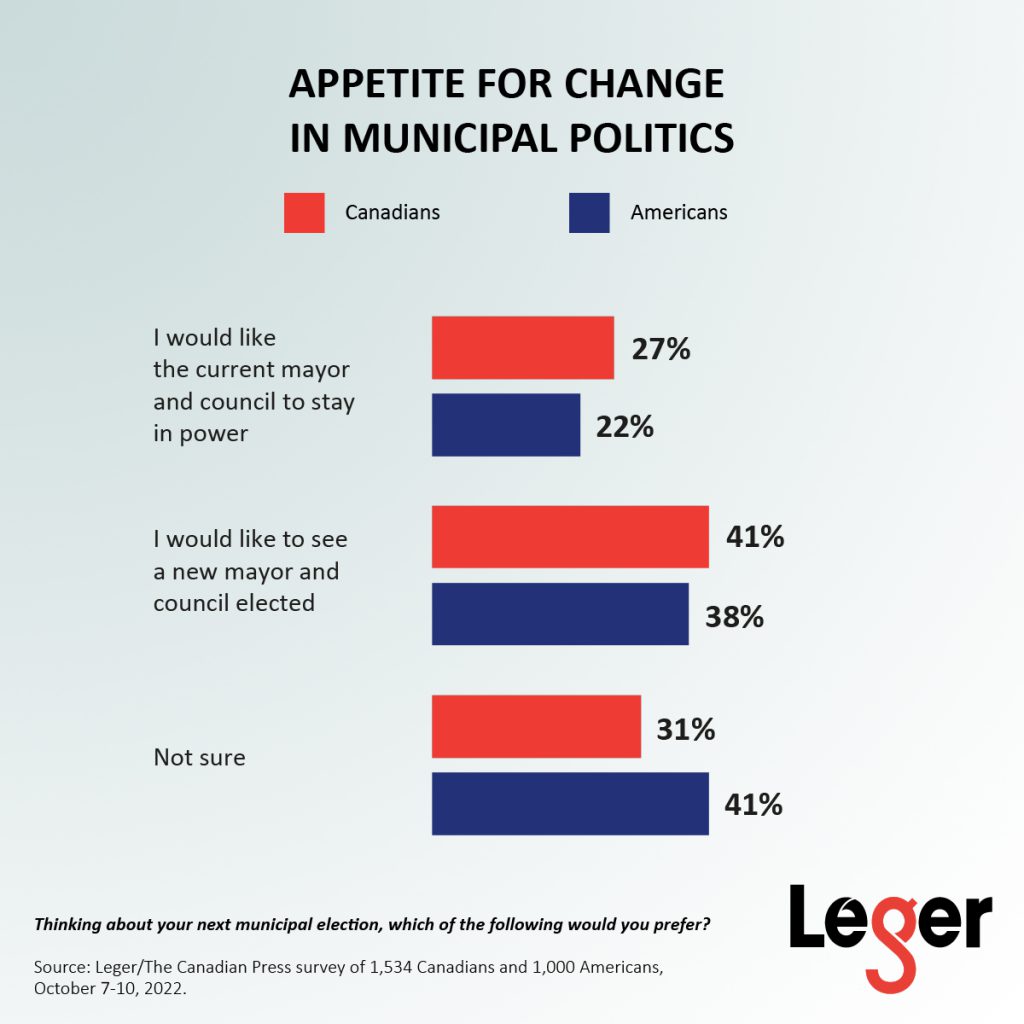
- 41% of Canadians and 38% of Americans would prefer to see a new mayor and council elected next election.

FEDERAL VOTING INTENTIONS IN CANADA
- If a federal election were held today, 33% of Canadian decided voters would vote for the Conservative Party of Canada, followed by 31% who would vote for the Liberal Party of Canada and 21% who would vote for the New Democratic Party of Canada.
METHODOLOGY
This web survey was conducted from October 7 to 10, 2022, with 1,534 Canadians and 1,000 Americans, 18 years of age or older, randomly recruited from LEO’s online panel.
A margin of error cannot be associated with a non-probability sample in a panel survey. For comparison, a probability sample of 1,534 respondents would have a margin of error of ±2.50%, 19 times out of 20, while a probability sample of 1,000 respondents would have a margin of error of ±3.09%, 19 times out of 20.
THIS REPORT CONTAINS THE RESULTS FOR THE FOLLOWING QUESTIONS AND MORE!
- Thinking of your mayor and council in your municipality, would you say you generally approve or disapprove of the way they are doing their jobs?
- Would you say things are better or worse in your municipality based on the job the mayor and council have done since they were elected?
- Thinking about your next municipal election, which of the following would you prefer?
