DOWNLOAD THE FULL REPORT AT THE END OF THIS ARTICLE
Every week, we survey Canadians and Americans to explore their perspectives on COVID-19 and other current events. Stay up to date on the latest trends and discover our most recent results below.
This survey is conducted in collaboration with the Association for Canadian Studies (ACS) and published in the Canadian Press. This series of surveys is available on Leger’s website.
HALLOWEEN AND THANKSGIVING
- Given the current pandemic, 48% of Canadians and 54% of Americans whose children went trick-or-treating last year say they will let their children go trick-or-treating this year.
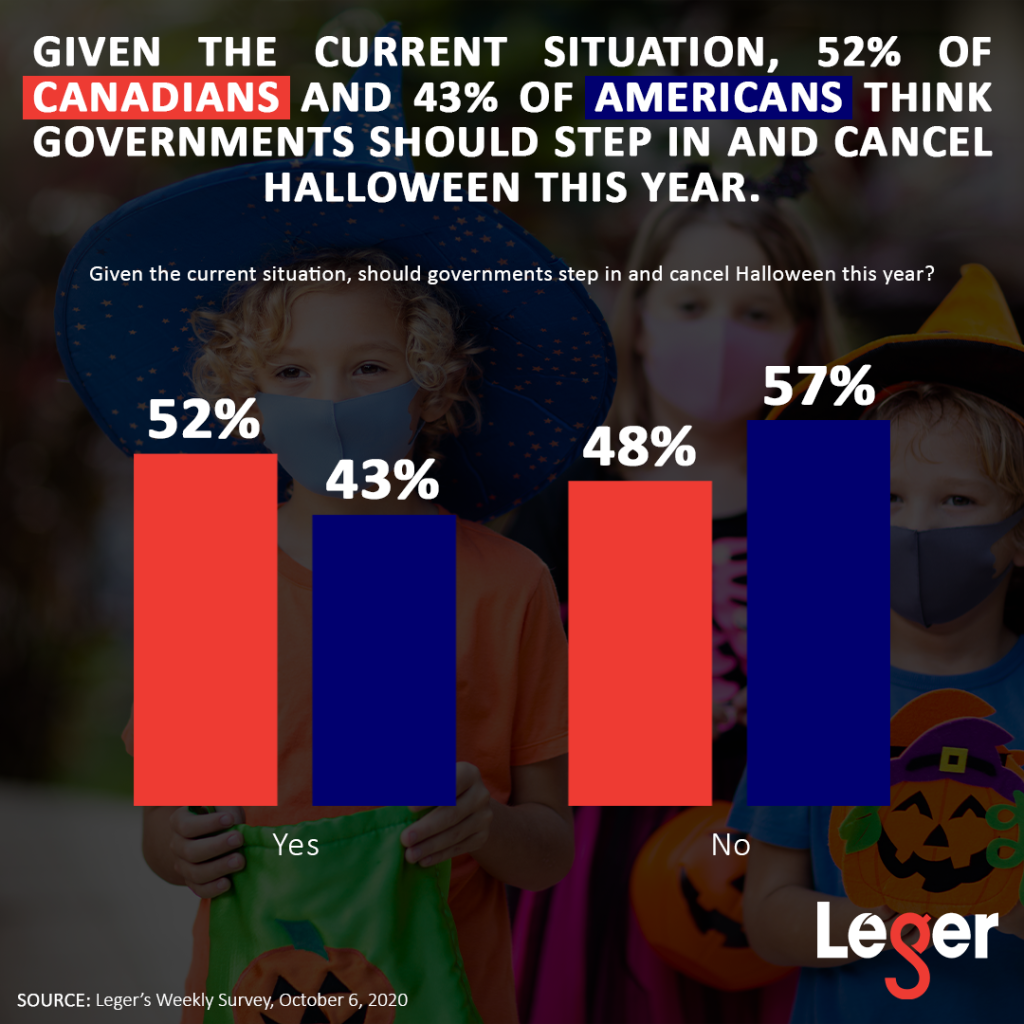
- Given the current situation, 52% of Canadians and 43% of Americans think governments should step in and cancel Halloween this year.
- 40% of Canadians and 56% of Americans say they have not changed or will not change their plans for Thanksgiving this year.

THE U.S. ELECTION
- 34% of Americans say the presidential debate gave them an extra reason to go out and vote, 7% say it has discouraged them from voting, and 58% say it will not impact their intention to go out and vote.
- If the 2020 U.S. presidential election were held today, 43% of decided American voters who are registered to vote and intend to vote in the next election would vote for Donald Trump and 53% would vote for Joe Biden.
COVID-19
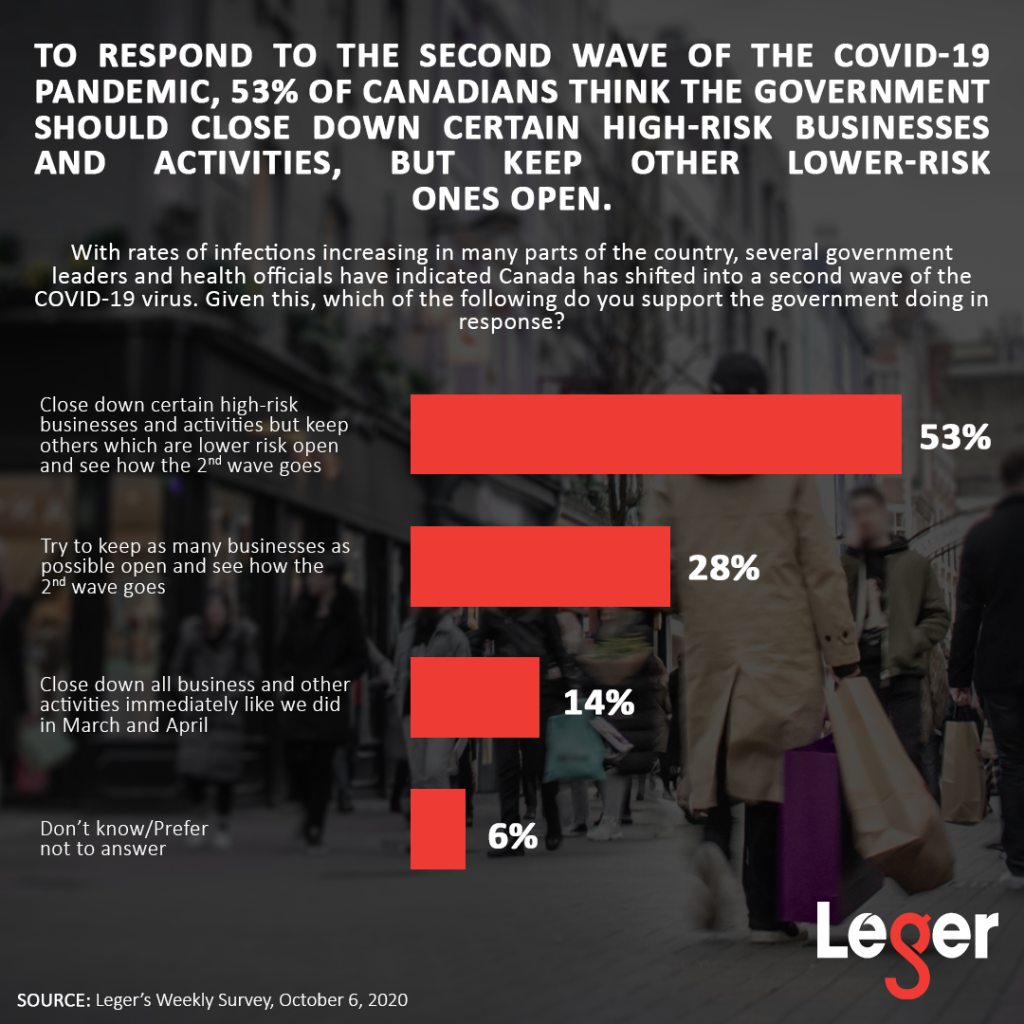
- To respond to the second wave of the COVID-19 pandemic, 53% of Canadians think the government should close down certain high-risk businesses and activities, but keep other lower-risk ones open.

SURVEY METHODOLOGY
This web survey was conducted from October 2-4, 2020, with 1,523 Canadians and 1,001 Americans, 18 years of age or older, randomly recruited from LEO’s online panel.
Using 2016 Census reference variables, the Canadian data was then analyzed and weighted by our statisticians according to gender, age, mother tongue, region, education level and the presence of children in households in order to render a representative sample of the general population. Using 2010 U.S. Census reference variables, the American data was then analyzed and weighted by our statisticians according to gender, age, region, race/ethnicity and household size in order to render a representative sample of the general population.
For comparison, a probability sample of 1,523 respondents would have a margin of error of ±2.51%, 19 times out of 20, while a probability sample of 1,001 would have a margin of error of ±3.1%, 19 times out of 20. The research results presented here are in full compliance with the CRIC Public Opinion Research Standards and Disclosure Requirements.
THIS REPORT CONTAINS THE RESULTS FOR THE FOLLOWING QUESTIONS AND MORE!
- Which of the following best represents your opinion on the presidential debate?
- Who do you think will win the VP debate between Kamala Harris and Mike Pence?
- Given the current pandemic, will you let your children go trick-or-treating this year?
- Given the current situation, should governments step in and cancel Halloween this year?
- Given the current pandemic, have you or will you change your plans for Thanksgiving this year?
