Every month, we conduct a survey of Canadians and Americans to explore their views on the economy, finances, and their respective governments. This month, our survey was conducted between September 22 and 24, 2023.
This survey explores Canadians’ and Americans’ perspectives on their household finances and economic uncertainty, and Canadians’ perspectives on federal politics.
Download the report for the full results.
This series of surveys is available on Leger’s website. Would you like to be the first to receive these results? Subscribe to our newsletter now.
Some of the key highlights of our survey about Canadians and Americans’ finances include…
- Nearly half of Canadians (46%) and Americans (42%) are currently living paycheck to paycheck. This represents no significant change since August 2023.
- 63% of Canadians think their country is experiencing an economic recession, in contrast to 55% of Americans who feel the same.
- Among Canadians who are currently employed, one-third (33%) are concerned about losing their job in the next 12 months, and the proportion is the same among Americans (33%).
- Despite the current situation, 61% of Canadians say the state of their household finances is good, while 36% say the state of their household finances is poor. Americans are more optimistic, with 67% saying their household finances are good.
Canadians think that Pierre Poilievre would make the best prime minister
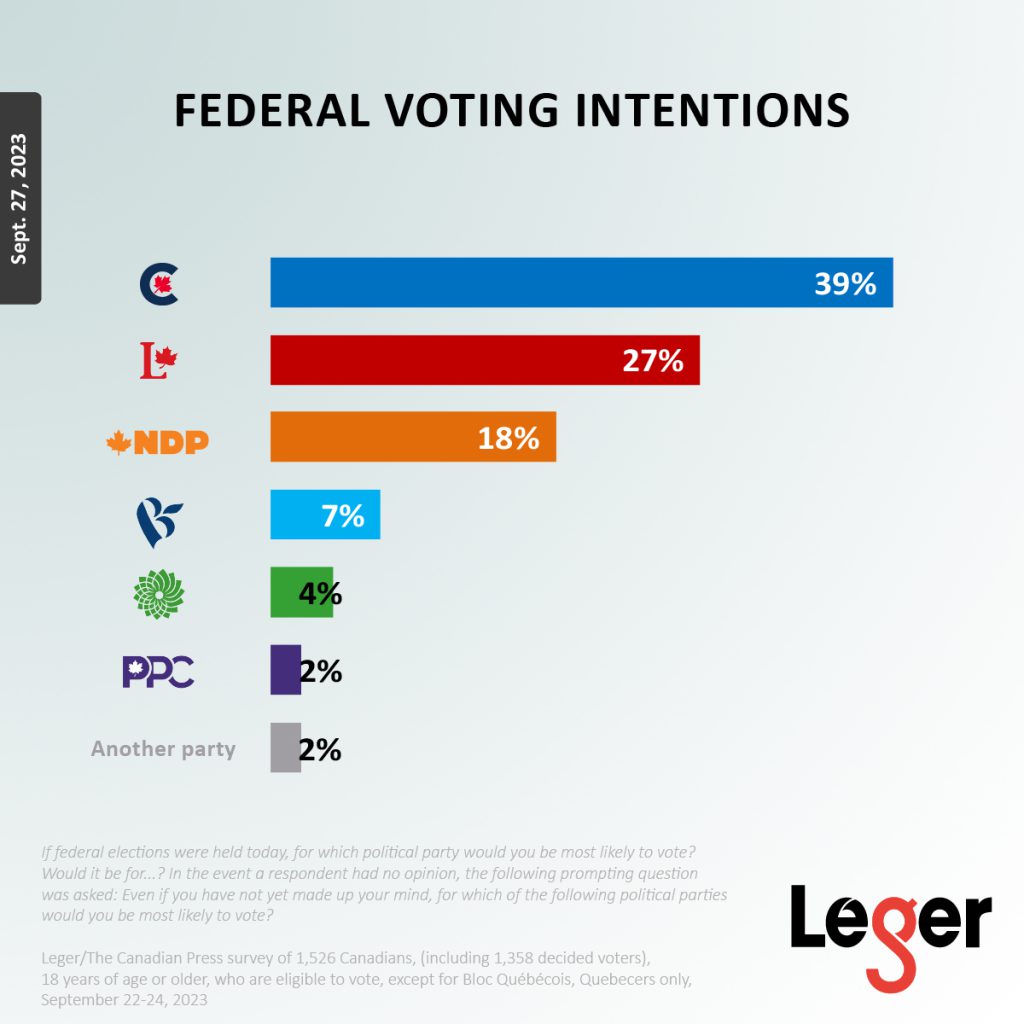
- The Conservative Party of Canada, headed by Pierre Poilievre, is currently leading in voting intentions with 39% support among decided voters. On the other hand, the Liberal Party, led by Justin Trudeau, has 27% support.
- 26% of Canadians believe that Pierre Poilievre would be the best person to serve as the Prime Minister of Canada, while 20% think that Trudeau would be the ideal candidate for the position.

METHODOLOGY
This web survey was conducted from September 22 to 24, 2023, with 1,652 Canadians and 1,000 Americans, 18 years of age or older, randomly recruited from LEO’s online panel.
A margin of error cannot be associated with a non-probability sample in a panel survey. For comparison, a probability sample of 1,652 respondents would have a margin of error of ±2.4%, 19 times out of 20, while a probability sample of 1,000 respondents would have a margin of error of ±3.1%, 19 times out of 20.
