
This article is part of our regular B.C. Government Report Card series. Click on the links below to see the previous editions:
We surveyed British Columbians from September 15 to 18 to explore their perspectives on the B.C. government, including their opinions of the party leaders, their voting intentions, the most important issues facing their province, and more.
This wave of the study was done in partnership with Global Public Affairs.
SOME OF THE KEY FINDINGS OF OUR OCTOBER 2023 B.C. GOVERNMENT REPORT CARD SURVEY INCLUDE…
MOST IMPORTANT ISSUE AND PROVINCE TRAJECTORY
- 29% of British Columbians think that housing prices/affordability is the most important issue facing their province. 14% think that healthcare is the most important issue, and 13% think it is inflation/rising interest rates.
- Longer-term trending shows how much issues tend to bounce around over time as priorities, economic pressures and issues shift in BC, though housing prices/affordability has consistently led all issues since May 2016.
- 52% of British Columbians think that things in their province are on the wrong track.
LEADER APPROVAL RATINGS
- Premier David Eby receives the highest approval rating of the leaders at 47%. Green Party leader Sonia Furstenau’s approval rating is 27%, BC United leader Kevin Falcon’s is 26%, and Conservative Party leader John Rustad’s is 23%.
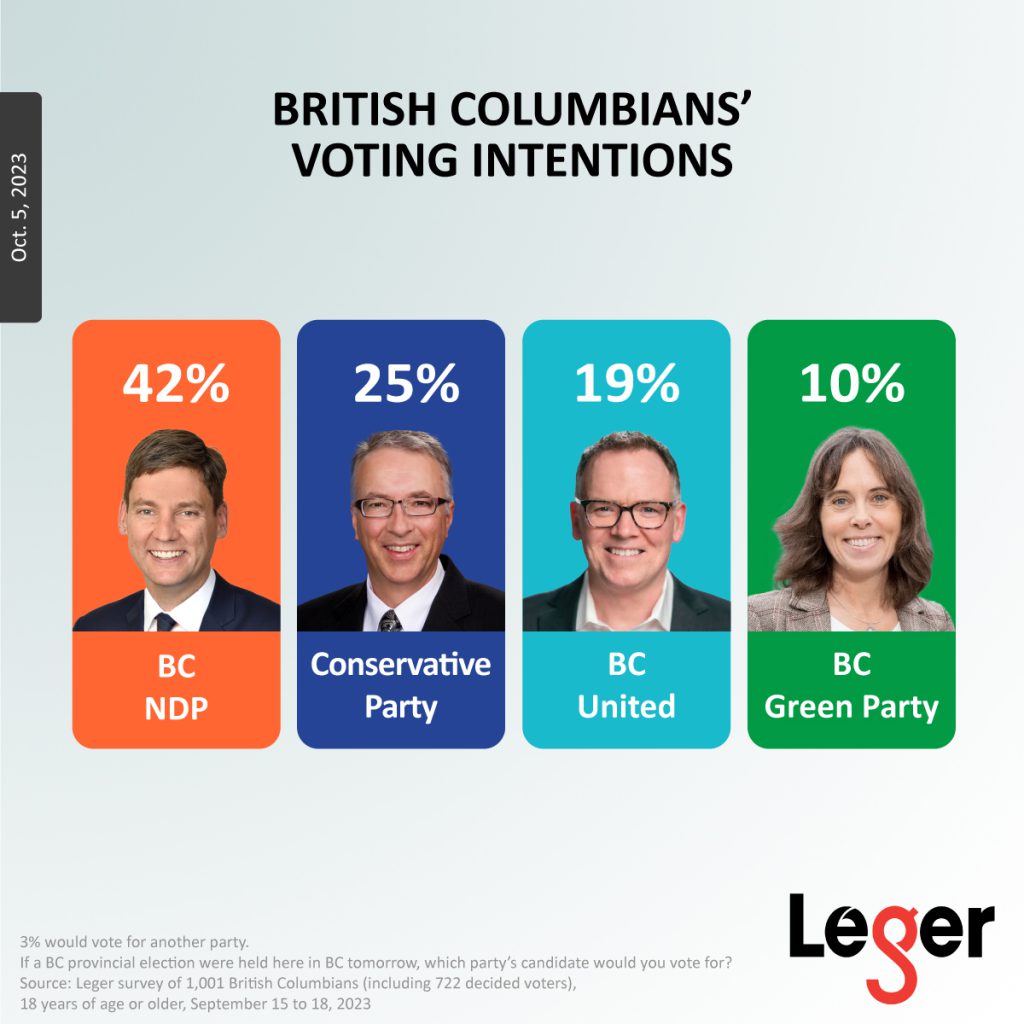
PROVINCIAL VOTING INTENTIONS
- If a provincial election were held tomorrow, 42% of British Columbia decided voters would vote for the BC NDP, 25% would vote for the BC Conservative Party, 19% would vote for BC United, 10% would vote for the BC Green Party, and 3% would vote for another party.
SURVEY METHODOLOGY
- For this wave of research, 1,001 residents of British Columbia aged 18 or older were surveyed online using Leger’s online panel, LEO, from September 15 to 18, 2023.
- The data was weighted according to the Canadian census figures for age, gender and region within the province.
- No margin of error can be associated with a non-probability sample. However, for comparative purposes, a probability sample of 1,001 respondents would have a margin of error of ±3.1%, 19 times out of 20.