Recently, there have been many protests in the United States which are focused on systemic racism in American society. The past couple of weeks have seen peaceful protests, as well as protests which have turned violent and led to looting of stores and destruction of property.
From June 5 to 7, 2020, Leger conducted a survey among Canadians and Americans to understand their perspectives on the current protests underway in the United States and their views on racism.
HIGHLIGHTS
SUPPORT FOR DIFFERENT GROUPS INVOLVED IN THE PROTESTS
We asked Canadians and Americans the extent to which they support or oppose different groups involved in the protests, including the protesters, police officers, state government officials, and President Trump.
In Canada, nearly three-quarters of Canadians (72%) support the protesters, and less than two-in-five support the police officers (39%), the state government officials (33%) and President Trump (9%).

In contrast, significantly fewer Americans (63%) support the protesters compared to Canadians, and significantly more Americans support the police officers (55%), the state government officials (52%) and President Trump (38%)
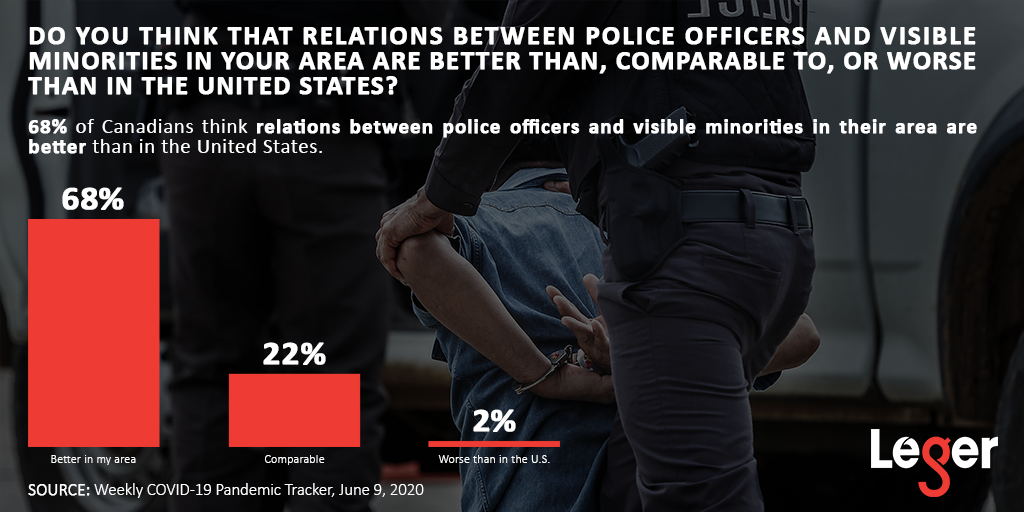
PERCEPTIONS ABOUT POLICE RELATIONS
We also asked Canadians whether they feel relations between the police and the public in their area are better than, comparable to, or worse than in the United States. Over three-quarters (77%) feel these relations are better than in the United States, 15% feel they are comparable, and 3% feel they are worse.
When it comes to relations between the police and visible minorities in their area, two-thirds (68%) of Canadians feel the relations are better than in the United States, 22% feel they are comparable, and 2% feel they are worse.
SURVEY METHODOLOGY
This web survey was conducted from June 5 to June 7, 2020, with 1,523 Canadians and 1,001 Americans, 18 years of age or older, randomly recruited from LEO’s online panel.
Using data from the 2016 Census, the results were weighted by gender, age, mother tongue, region, education level and presence of children in the household in order to ensure a representative sample of the population.
For comparison, a probability sample of 1,523 respondents would have a margin of error of ±2.51%, 19 times out of 20, while a probability sample of 1,001 would have a margin of error of +3.1%, 19 times out of 20. The research results presented here are in full compliance with the CRIC Public Opinion Research Standards and Disclosure Requirements.